Blog

S&P/Case-Shiller: Home Prices Lose Seasonal Support. Momentum Moderating
Standard and Poor's released the Case Shiller Home Price Index this morning.
The S&P/Case-Shiller Home Price Indices are constructed to accurately track the price path of typical single-family homes located in each metropolitan area provided. Each index combines matched price pairs for thousands of individual houses from the available universe of arms-length single family homes sales data. The indices have a base value of 100 in January 2000; thus, for example, a current index value of 150 translates to a 50% appreciation rate since January 2000 for a typical home located within the subject market.
In last month's release, U.S. home prices, as measured by the 20 city index rose by 0.3% on a month over month basis, less than the 0.8% gain the market was anticipating. The 10-city index rose 0.4% in September. This marked the fifth consecutive month of home price appreciations.
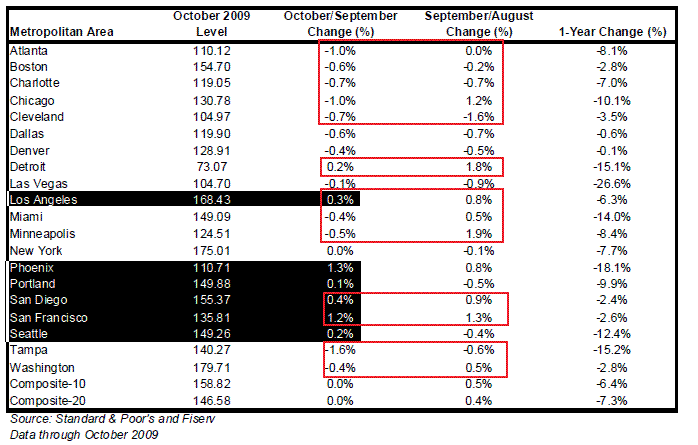
In this month's data, which reported on home price changes in October, both the 20 city index and 10 city index were flat on a month to month basis. The 20 city composite ticked up 0.0% to 146.58 from 146.51 while the 10 city index rose 0.0% from 158.61 to 158.82. On a year over year basis the 20 city index is down 7.3% and the 10 city index is 6.4% lower.
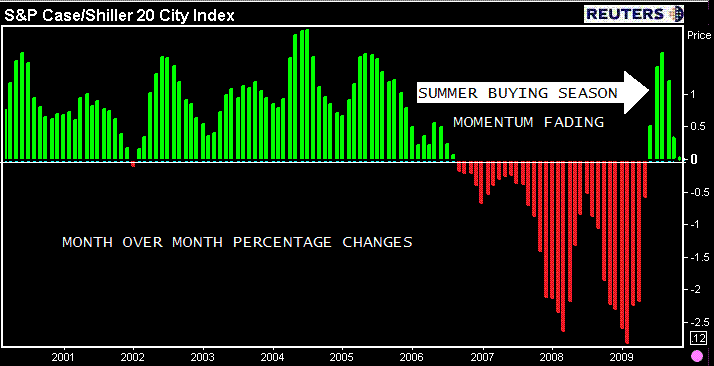
The below chart illustrates waning momentum in month over month home price appreciations. The supportive influence of seasonal buying is wearing off.

In regards to specific regions. Foreclosure ridden western cities were the top relative performers while the entire east coast was a drag.
In August, 17 of 20 cities reported month over monthrnappreciations. In September, 10 out of 20 cities reported monthrnover month improvements. In October ,6 out of 20 cities reported price appreciations (all west coast. NY was flat). Also in Octoberr, 12 out of 20 cities experienced larger month over month declines (red boxes).

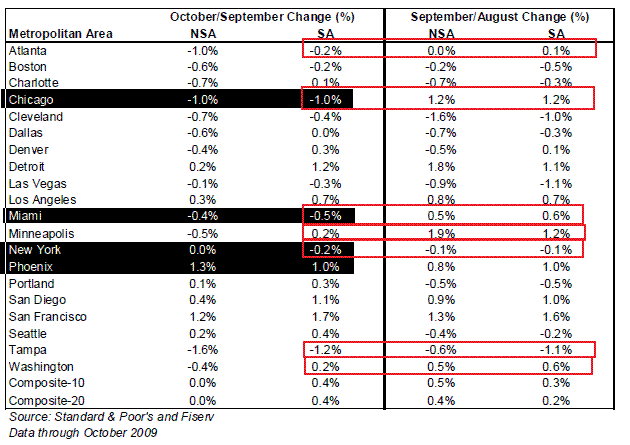
The above data is not seasonally adjusted though (S&P/Case-Shiller reports it that way). Seasonal influences are however obvious when you look at the adjusted data.
On an adjusted basis both the 10 city and 20 city were up 0.4% in October. In only four cities was the seasonally adjusted data not better than the unadjusted data. 8 out of 20 cities reported growth on an adjusted basis. Compare that to 6 cities on a non-adjusted basis. NSA, 12 cities contracted on a month to month basis. SA, 7 of 20 cities fared worse in October.
All around better when adjusted for seasonal influences.

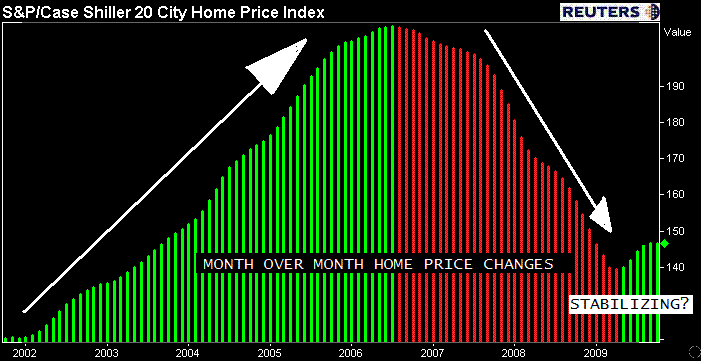
Not trying to highlight weakness. More than anything I would like to again call attention to the perception of recovery vs. the perception of stabilization. Relative to the speed and extent the housing market rose and fell, not much progress has been made towards a recovery. Just a stabilization from free fall. This chart illustrates the marginal progress that has been made…

These comments from David M. Blitzer, Chairman of the Index Committee at Standard & Poor’s, addresses concerns about a conflict of perceptions.
“The turn-around in home prices seen in the Spring and Summer has faded with only seven of the 20 cities seeing month-to-month gains, although all 20 continue to show improvements on a year-over-year basis. All in all, this report should be described as flat.”.
“Coming after a series of solid gains, these data are likely to spark worries that home prices are about to take a second dip. Before jumping to conclusions, recognize that the one time that happened at the beginning of the 1980s, Fed policy saw dramatic reversals, which is very different from the stable and consistent Fed policy we have today. Further, sales of existing homes – those included in the S&P/Case-Shiller Home Price Indices – have been very strong in recent months, working off the inventories of houses for sale. At the same time, housing starts remain weak, fears that the market will be swamped by a wave of foreclosures are heard and government programs aimed at the housing market will expire in the first half of 2010.”
This may be getting redundant but I would have added a comment on jobs.
Here are some comments from the recent Existing Home Sales post:
NAR President Vicki Cox Golder, owner of Vicki L. Cox & Associates in Tucson, Ariz., says conditions are optimal for buyers in the current market: “Inventories have steadily declined and are closer to balanced levels, which indicate home prices in many areas are either stabilizing or could soon stabilize and return to normal appreciation patterns,”
WOOOO HOOOO again…and now for the “YEH BUT”!
“This means buyers still have good choices but are purchasing near the bottom of the price cycle with historically low mortgage interest rates. Throw a tax credit on top and it really doesn’t get any better for buyers with secure jobs and long-term ownership plans.”
Buyers must have jobs! I suppose I could make it clearer.
According to the US Census Bureau and the BLS: 17.2% of Americans are underemployed or unemployed. Out of 153.9 million people in the labor force…26.5 million are unemployed or underemployed. (U6)
Plain and Simple: NO JOB= NO INCOME = BAD DTI = NO MORTGAGE.
Until jobs are being created (in droves) for the herd of citizens on unemployment benefits, the housing market will undergo a slow, frustrating recovery process, for mortgage and real estate professionals especially. The industry is not done contracting, profit margins will continue to shrink and more jobs will be lost as new regulations take effect and main stream lenders increase competitiveness within the mortgage sector. Stay cost efficient, stay nimble…
All Content Copyright © 2003 – 2009 Brown House Media, Inc. All Rights Reserved.nReproduction in any form without permission of MortgageNewsDaily.com is prohibited.
Latest Articles
By John Gittelsohn August 24, 2020, 4:00 AM PDT Some of the largest real estate investors are walking away from Read More...
Late-Stage Delinquencies are SurgingAug 21 2020, 11:59AM Like the report from Black Knight earlier today, the second quarter National Delinquency Survey from the Read More...
Published by the Federal Reserve Bank of San FranciscoIt was recently published by the Federal Reserve Bank of San Francisco, which is about as official as you can Read More...

Comments
Leave a Comment