
Blog

CoreLogic Estimates Shadow Inventory at 1.8 Million Homes
For the second time in less than a week economists havernattempted to quantify the amount of shadow inventory currently lurking in the background of the housing market. </p
Shadow inventory is generally defined asrnthe number of distressed homes either on the market or likely to come on the marketrnthrough foreclosure divided by the rate at which distressed properties arerncurrently selling. The two studies, one conducted by the National Associationrnof Realtors® and the other released byrnCoreLogic, follow different methodology but arrive at similar conclusions: shadow inventory is substantial, it will take a long timernto clear it out, home prices will be pressured downward and it will strain the economy. </p
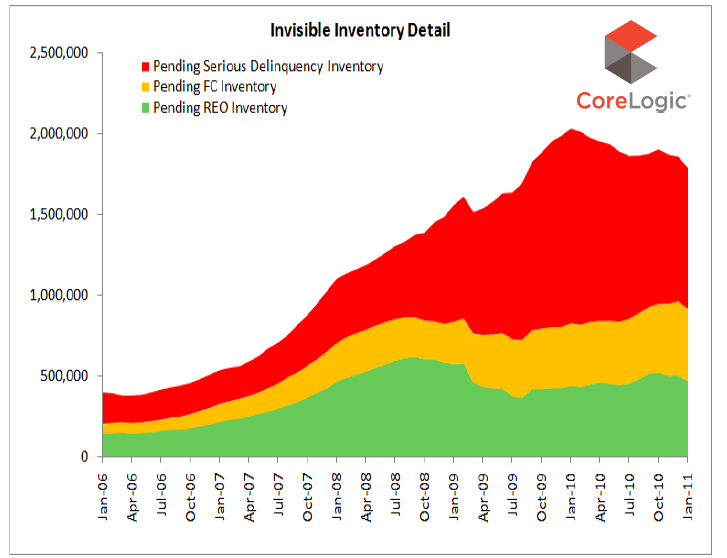
As of January 2011, CoreLogic estimates shadow inventory to be at 1.8rnmillion houses, which works out to a nine month supply. rnThis was a slight improvement from the 2.0 million estimate reportedrnone year ago which also represented a nine month backlog. </p
Inventory is made up of 870,000 housesrnwith mortgages that are seriously delinquent (4.2 months supply), 445,000rnproperties in some stage of foreclosure (2.1 months) and 470,000 houses (2.2rnmonths) already in bank-owned inventory (REO).</p
 </p
</p
SEE ANOTHER CHART: LPS Data Shows Long Delays in Foreclosure Process</p
Mark Fleming, chief economist for CoreLogic commented, “While the trend of the shadow inventory is improving somewhat, the current level and distressed months’ supply remain very high. The short-term weakness in prices and longer-term weakness in the drivers that affect the housing market imply that excess supply will remain high for an extended period of time.”</p
Equally distressing, the CoreLogic study found additionalrnloans, numbering around 2 million that are upside-down to the point that thernowners have a mortgage at least 50 percent greater than the value of the home. These the company feels will also become partrnof the shadow supply in the near future, thus potentially more than doubling therncurrent shadow inventory.</p
For the first time CoreLogic looked at how loan modificationsrnand short sales could reduce shadow inventory levels. Based on optimal treatment methods, netrnpresent value calculations, redefault rates, and other factors they found thatrnloan modifications and short sales have the potential of reducing the shadowrnsupply by one-half. However, because ofrnpoor borrower response to lender outreach and high rates of redefault, thernactual effect of remediation would be slight.</p
The study found New Jersey, Illinois, and Maryland had thernhighest shadow inventories among the states (NAR’s study which was done on the staternlevel had a substantially different list) while the lowest inventory was inrnthree small states that did not go through a boom/bust cycle, North Dakota,rnAlaska, and Wyoming.</p
CoreLogic is a California company which provides consumer,rnfinancial and property information, analytics, and services to businesses andrngovernment.</p
CoreLogic’s Methodology: CoreLogic utilized its LoanPerformance Servicing and Securities databases to size the number of 90+ day delinquencies, foreclosures and REOs. Roll rates, which measure the proportion of loans that were in one stage of default that rolled to the next stage of default over a period of time, were applied to the number of loans in default by each stage of default. This calculation allowed for estimating the number of loans that were proceeding from earlier to later stages of default. Then we calculated the share of loans in default that are currently listed on MLS by matching public record properties in default to MLS active listings. We applied the percentage of defaulted loans that are being listed to our estimate of outstanding loans that will proceed to further stages of default to calculate the pending supply inventory by stage of default and added that to the visible inventory that is reported for existing homes and new homes by the National Association of Realtors and the Bureau of the Census, respectively. To determine months’ supply for visible and shadow inventories, we utilized the number of non-seasonally adjusted home sales according to CoreLogic.
All Content Copyright © 2003 – 2009 Brown House Media, Inc. All Rights Reserved.nReproduction in any form without permission of MortgageNewsDaily.com is prohibited.
About the Author
devteam
Steven A Feinberg (@CPAsteve) of Appletree Business Services LLC, is a PASBA member accountant located in Londonderry, New Hampshire.
See all blogsLatest Articles
By John Gittelsohn August 24, 2020, 4:00 AM PDT Some of the largest real estate investors are walking away from Read More...
Late-Stage Delinquencies are SurgingAug 21 2020, 11:59AM Like the report from Black Knight earlier today, the second quarter National Delinquency Survey from the Read More...
Published by the Federal Reserve Bank of San FranciscoIt was recently published by the Federal Reserve Bank of San Francisco, which is about as official as you can Read More...
Comments
Leave a Comment