Blog

Home Prices Improve at Fastest Rate Since 2006, Driven by Western States
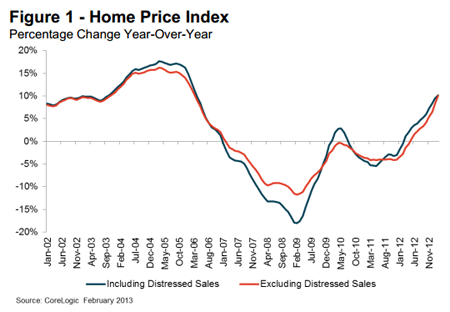
Rapidly rising home prices were confirmed by anotherrnreport this morning, this one from CoreLogic. rnIts Home Price Index (HPI) jumped 10.2 percent on an annual basis inrnFebruary, the biggest year-over-year increase since March 2006 and the 12th</supconsecutive month that home prices have risen nationally. The HPI, which includes sales of distressedrnproperties, also increased on a monthly basis, rising 0.5 percent from Januaryrnto February 2013. When sales ofrnlender-owned real estate (REO) and short-sales are excluded from therncalculations home prices increased by 10.1 percent on an annual basis and 1.5rnpercent from January to February. </p
CoreLogic’s Pending HPI for March indicatesrnanother 10.2 percent increase from March 2012 and a 1.2 percent increase fromrnJanuary to February. Excludingrndistressed sales, March 2013 home prices are poisedrnto rise 11.4 percent year over year from March 2012 and by 2.0 percent monthrnover month from February 2013. The Pending HPI is based on Multiple ListingrnService (MLS) data that measure price changes for the most recent month.</p
 </p
</p
The states with the greatest homernappreciation including distressed sales were Nevada (+19.3 percent), Arizonarn(18.6 percent), California (15.3 percent), Hawaii (14.6 percent) and Idaho (13.5rnpercent). When distressed sales arernexcluded the same five states lead in prices increases with only slight changesrnin the order and number; Nevada (18.3rnpercent), Arizona (16.4 percent), Hawaii (15.5 percent), California (15.3rnpercent) and Idaho (15.3 percent).</p
Delaware was the only state to postrna decrease in home values on both the HPI including distressed sales (4.4rnpercent) and the HPI excluding them (1.9 percent) but Alabama (1.5rnpercent) and Illinois (-1.0 percent) also showed price depreciation whenrndistressed sales were included.</p
Including distressed transactions,rnthe peak-to-current change in the national HPI (from April 2006 to Februaryrn2013) was -26.3 percent. Excluding distressed transactions, the peak-to-currentrnchange in the HPI for the same period was -19.3 percent. Even with the recent price increases Nevadarnis still down from its peak price level by 50.8 percent when distressed salesrnare included followed by Florida at 43.3 percent. Other states with peak-to-current pricerndepreciation exceeding 35 percent are Michigan, Arizona, and Rhode Island. </p
“The rebound in prices isrnheavily driven by western states. Eight of the top ten highest appreciatingrnlarge markets are in California, with Phoenix and Las Vegas rounding out thernlist,” said Dr. Mark Fleming, chief economist for CoreLogic. </p
“Home prices continued theirrnmarch upward in February. Nationally, home prices improved at the best raternsince mid-2006, marking a full year of annual increases and underscoring thernongoing strengthening of market fundamentals,” said Anand Nallathambi,rnpresident and CEO of CoreLogic. “Continued home price appreciation willrnprovide fuel needed to drive further recovery in the home purchasernmarket.”
All Content Copyright © 2003 – 2009 Brown House Media, Inc. All Rights Reserved.nReproduction in any form without permission of MortgageNewsDaily.com is prohibited.
Latest Articles
By John Gittelsohn August 24, 2020, 4:00 AM PDT Some of the largest real estate investors are walking away from Read More...
Late-Stage Delinquencies are SurgingAug 21 2020, 11:59AM Like the report from Black Knight earlier today, the second quarter National Delinquency Survey from the Read More...
Published by the Federal Reserve Bank of San FranciscoIt was recently published by the Federal Reserve Bank of San Francisco, which is about as official as you can Read More...

Comments
Leave a Comment