
Blog

Case-Shiller Numbers Up; Even Hard-hit Sunbelt Cities Improving
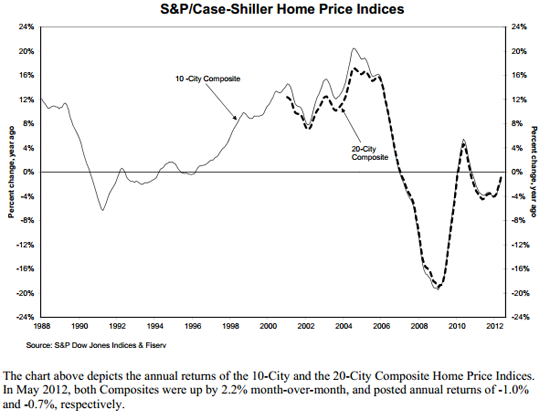
The home price picture showed further improvementrnwith the release this morning of the S&P/Case-Shiller Home Price Indices</b(HPI) for May. Both the 10-City and thern20-City composite indices increased by 2.2 percent compared to April and, whilernthe numbers were still lower than one year earlier, the difference was substantiallyrnsmaller than in April. </p
The May 2012 number for the 10-CityrnComposite was -1.0 percent compared to a year earlier and for the 20-City itrnwas -0.7. In April the year-over-yearrnchanges were -2.2 percent and -1.9 percent respectively and those numbers had,rnin turn, been a substantial improvement over those in March. </p
 </p
</p
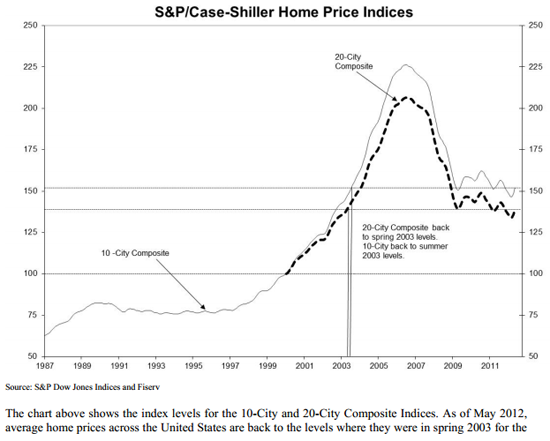
To provide some perspective on thernindices, the 10 and 20-City Composite numbers for May 2012 were 151.79 and 138.96rncompared to May 2011 when they were 153.93 and 139.88. Therntwo composites hit and sustained peak numbers through most of 2006 within a fewrndecimal places of 226.0 and 206.0 respectively. Measured from the peaks duringrnthis period both composites are down about 35 percent. As of May, average home prices nationally arernback to the levels of Spring 2003 for the 10-City Composite and the summer ofrnthat year for the 20-City. The base ofrn100 for the indices was set in January 2000. </p
 </p
</p
All 20 of the MSAs covered by thernindices saw positive monthly returns in May and 17 had increased annual returnsrnin May compared to April. Only Boston,rnCharlotte, and Detroit declined and each by less than 1 percent. Atlanta continues to be the only city postingrna double-digit annual negative return, declining 14.5 percent. Even that is an improvement over the 17.0rnpercent drop reported in April. </p
“With May’s data, we saw a continuingrntrend of rising home prices for the spring,” David M. Blitzer, Chairman of thernIndex Committee at S&P Dow Jones Indices said. “On a monthly basis, all 20 cities and bothrnComposites posted positive returns and 17 of those cities saw those rates ofrnchange increase compared to what was observed for April. We have observed two consecutive months ofrnincreasing home prices and overall improvements in monthly and annual returns;rnhowever, we need to remember that spring and early summer are seasonally strongrnbuying months so this trend must continue throughout the summer and into thernfall.”</p
Some of the cities hardest hit by foreclosuresrnand price declines seem to be roaring back. rnPhoenix again had the best annual return with home prices up 11.5rnpercent from one year earlier. Pricesrnare still half what they were at their 2006 but they have been increasingrnsteadily for the last five months. Miamirnand Tampa are two other hard-hit Sunbelt cities that are now showing positivernannual rates of change. Even Las Vegas,rnwhich topped the list of cities with the most foreclosure filings for over fourrnyears, posted a positive monthly change in May and an improvement in its annualrnnumbers.</p
Blitzer said that while many reports forrnJune including new home sales, housing starts, and mortgage default rates werernmixed all had improved on an annual basis. rn”The housing market seems to be stabilizing, but we are definitely in arnwait-and-see mode for the next few months.”
All Content Copyright © 2003 – 2009 Brown House Media, Inc. All Rights Reserved.nReproduction in any form without permission of MortgageNewsDaily.com is prohibited.
About the Author
devteam
Steven A Feinberg (@CPAsteve) of Appletree Business Services LLC, is a PASBA member accountant located in Londonderry, New Hampshire.
See all blogsLatest Articles
By John Gittelsohn August 24, 2020, 4:00 AM PDT Some of the largest real estate investors are walking away from Read More...
Late-Stage Delinquencies are SurgingAug 21 2020, 11:59AM Like the report from Black Knight earlier today, the second quarter National Delinquency Survey from the Read More...
Published by the Federal Reserve Bank of San FranciscoIt was recently published by the Federal Reserve Bank of San Francisco, which is about as official as you can Read More...
Comments
Leave a Comment