
Blog

Foreclosure Sales Lag as Banks Walk Inventory Tightrope
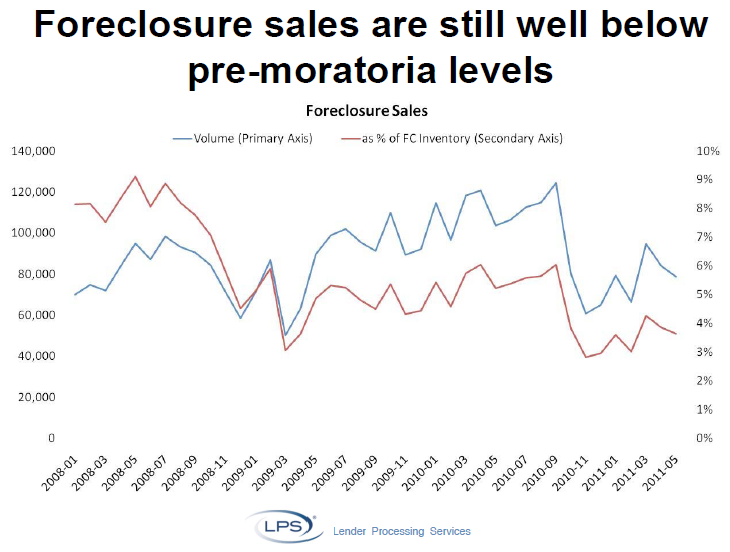
Foreclosurernsales have not regained the momentum they had before numerous lender moratoriarnbrought the process to a virtual halt last Fall. </p
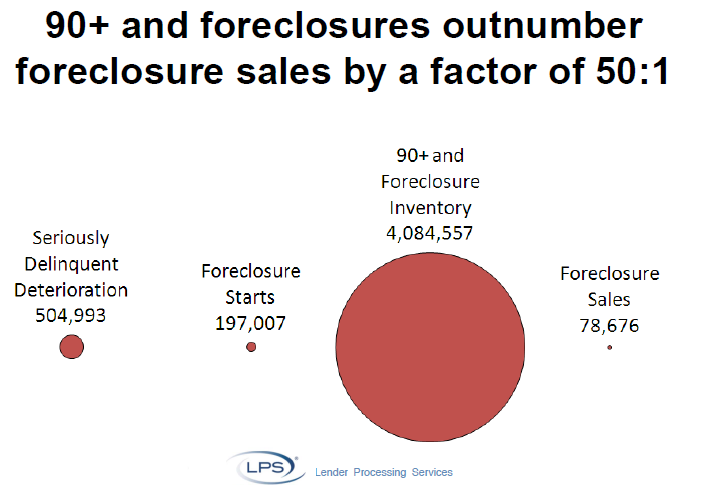
According to the May Mortgage Monitor Report released by Lender Processing Services, Inc. (LPS), the number ofrnserious delinquencies (90 days delinquent) and foreclosures (loans referred tornan attorney for foreclosures but not yet sold) outnumber the actualrnforeclosure sales by a factor of 50 to 1.</p
During the month of May there were a total of 4,084,557 loans that werernseriously delinquent or in foreclosure while only 78,676 foreclosure sales tookrnplace in the month.</p
 </p
</p
Therndelinquency rate was essentially unchanged from April at 7.97 percent but wasrndown from a rate of 9.74 in May 2010. rnThe foreclosure rate declined slightly to 4.11 percent from 4.14 but wasrnup substantially from the 3.66 percent rate a year earlier. Therernwere 197,007 foreclosure starts in May, nearly 10 thousand more than in Aprilrnbut down from 237,198 one year earlier. </p
Newrnproblem loans, defined as those that were 60 days or more delinquent during thernmonth but had been current six months earlier, were at 1.27 percent, down fromrnapproximately 1.80 percent a year earlier and less than one-half the peak levelrnseen in 2009.</p
Foreclosurernsales peaked almost exactly three years ago at around 130,000 per month and,rnafter a number of sharp monthly variations, were at almost that level lastrnSeptember when deficiencies in the foreclosure process were uncovered and foreclosurernsales plummeted to about 60,000 in October. rnSales have not recovered. Thern78,000+ sales in May represented less than 6 percent of the loans in thernforeclosure inventory.</p
 </p
</p
ThernMay data shows that the biggest drop in foreclosure sales since the Septemberrn2010 peak has been seen in East Coast states, with a decline of 96% in DC, 80%rnin Maryland, 79% in New York, and 75% in New Jersey. Additionally, inventoriesrnof foreclosures in judicial states have increased twice as much as inventoriesrnin non-judicial states over the last year.</p
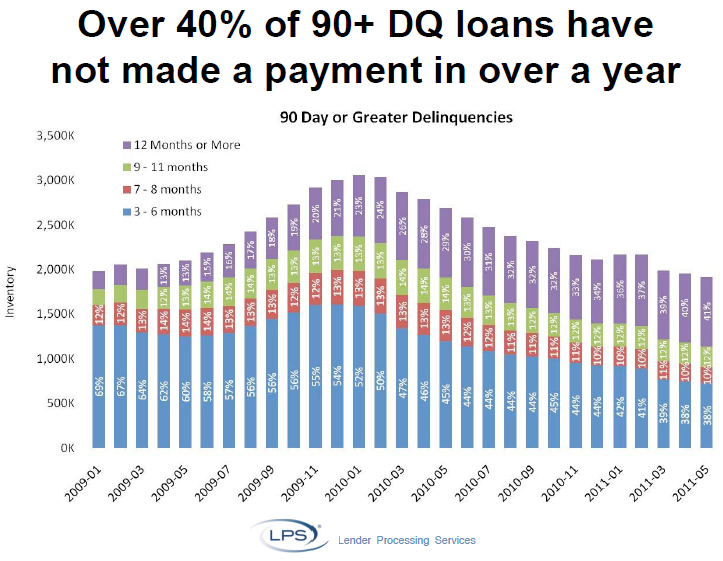
Thernaverage time a loan spends in foreclosure continues to increase. In May 40 percent of delinquent borrowers hadrnnot made a payment in over a year and one third of those in foreclosure had notrnmade a one in over two years.</p
 </p
</p
Negativernequity continues to be a problem. LPSrnreports that nearly 30 percent of performing loans are in a negative equity position. This is ominous as other LPS data shows thatrnunderwater loans default with 10 times the frequency of those where thernborrowers have equity. Of the 70 percent of current foreclosures with negativernequity, over 35 percent have combined loan to value ratios of over 150 percent.</p
The Million Dollar Question: Have Home Prices Bottomed?</p
“Nationally, housing faces a long road to recovery, but not all markets are equal”, says MND’s Managing Editor Adam Quinones. “While areas with a high concentration of distressed properties are clearly stuck in a deflating environment, some communities will see price stability. It’s all based on local and regional economies. Where are jobs being created? Where are the best schools? Where is value being created by the community? Where do buyers want to live? This is where the housing recovery can build momentum. Of course you need to be in the right financial situation to even be askingrn these questions. That’s another problem all together. Tight credit demands from lenders combined with damaged borrower credit profiles (andrn a lack of reserves) implies buyer demand will lag the broader economic recovery, which is lagging itself. Finding a bottom in the hardest hit areas is another story. Here, the GSEs, FHA, and major banks must managern their REO inventory carefully. In these areas, home prices remain highly-sensitivern to even the smallest of shocks in buyer sentiment, such as the premature release of shadow inventory. It’s gonna be a tight-rope walk. Step 1 is stopping the negative feedback loop.”</p
Foreclosure Filings in Downtrend. Masked Reality?</p
Housing Scorecard: Delinquencies Down. Foreclosures Delayed</p
Foreclosure Filings Drop. Prevention Policies Distorting Supply and Demand </p
LPS Data Shows Long Delays in Foreclosure Process</p
CoreLogic Estimates Shadow Inventory at 1.8 Million Homes</p
Foreclosure Filings Fall. Robogate Fallout Skews Report</p
ABOUT: LPSrndata is based on mortgage data and performance information on nearly 40 millionrnfirst mortgages across all types of credit products.
All Content Copyright © 2003 – 2009 Brown House Media, Inc. All Rights Reserved.nReproduction in any form without permission of MortgageNewsDaily.com is prohibited.
About the Author
devteam
Steven A Feinberg (@CPAsteve) of Appletree Business Services LLC, is a PASBA member accountant located in Londonderry, New Hampshire.
See all blogsLatest Articles
By John Gittelsohn August 24, 2020, 4:00 AM PDT Some of the largest real estate investors are walking away from Read More...
Late-Stage Delinquencies are SurgingAug 21 2020, 11:59AM Like the report from Black Knight earlier today, the second quarter National Delinquency Survey from the Read More...
Published by the Federal Reserve Bank of San FranciscoIt was recently published by the Federal Reserve Bank of San Francisco, which is about as official as you can Read More...
Comments
Leave a Comment