
Blog

S&P Case-Shiller: Home Prices Lose Momentum in November
Standard and Poor's released the Case-Shiller Home Price Index this morning.
The S&P/Case-Shiller Home Price Indices are constructed to accurately track the price path of typical single-family homes located in each metropolitan area provided. Each index combines matched price pairs for thousands of individual houses from the available universe of arms-length single family homes sales data. The indices have a base value of 100 in January 2000; thus, for example, a current index value of 150 translates to a 50% appreciation rate since January 2000 for a typical home located within the subject market.
OCTOBER S&P/CASE-SHILLER HOME PRICE INDEX
In last month's release, which reported on home price changes in October, both the 20 city index and 10 city index were flat on a month to month seasonally unadjusted basis. The 20 city composite ticked up 0.0% to 146.58 from 146.51 while the 10 city index rose 0.0% from 158.61 to 158.82. On a year over year basis the 20 city index was down 7.3% and the 10 city index was 6.4% lower. Seasonal influences were obvious in last month's release. On an adjusted basis both the 10 city and 20 city were up 0.4% in October.
NOVEMBER S&P/CASE-SHILLER HOME PRICE INDEX
Consensus Estimate: -0.1%
Result: Unadjusted -0.2%, Seasonally adjusted +0.2%
On a month over month basis, home prices in 20 US cities fell 0.2% in November. The 10 city index also fell by 0.2%
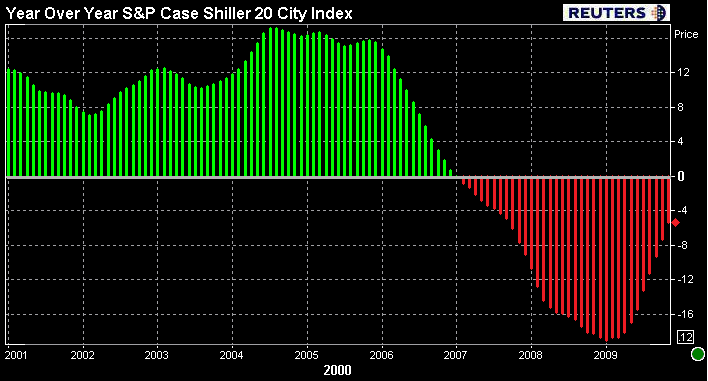
On a year over year basis, the 20 city index declined 4.5% while the 10 city index fell 5.3%.
While home prices are still falling on a year over year basis, this marksrnthe 10th consecutive month of improved annual readings and the third straight month thesernstatistics have registered single digit declines. This follows 20 consecutivernmonths of double digit declines. The chart below illustrates improving year over year price changes.
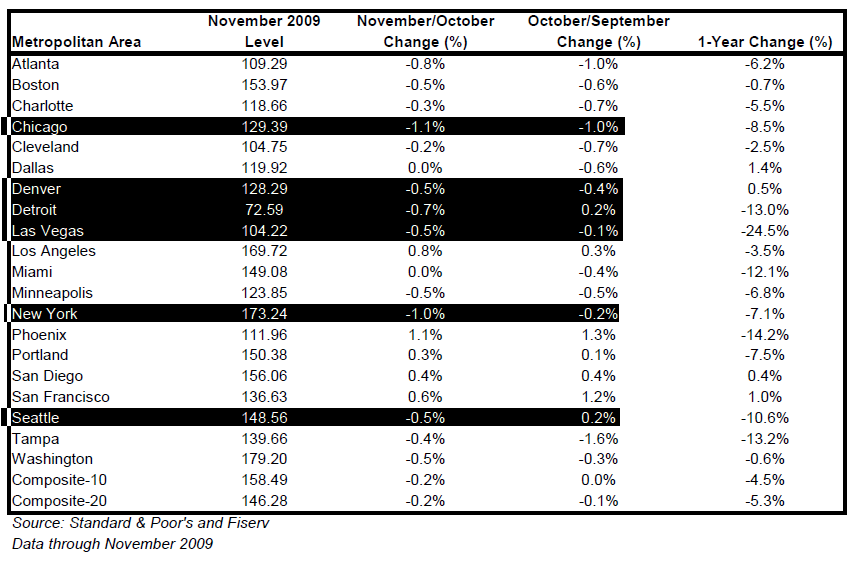
I have highlighted a few cities in the table below.
In November, 6 out of 20 cities contracted more than they had in the previous month: Chicago, Denver, Detroit, Las Vegas, New York, and Seattle. In October 8 out of 20 contracted at a faster rate than they had in the previous month.
David Blitzer, Chairman of the Index Committee at Standard & Poor’s adds: “Only five of thernmarkets saw price increases in November versus October. What is morerninteresting is that four of the markets – Charlotte, Las Vegas, Seattlernand Tampa – posted new low index levels as measured by the past fourrnyears. In other words, any gains they might have seen in recent monthsrnhave been erased and November is now considered their current troughrnvalue.”
Also note, looking at each city on a year over year basis…Dallas, Denver,rnSan Diego and San Francisco are all now seeing home price growth.
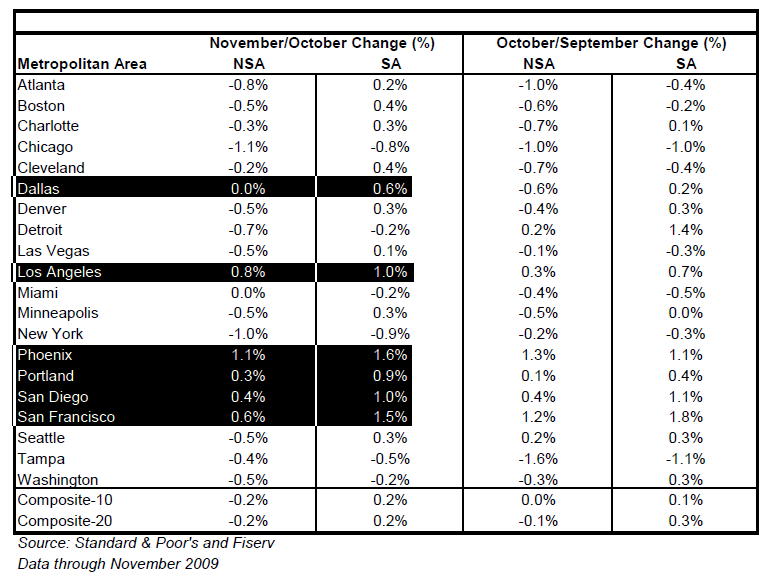
I should point out that the Case Shiller index is reported not-seasonally adjusted, seasonally adjusted numbers are however provided.
When adjusting for seasonal factors, home prices rose 0.2% in November. In the table below I highlighted the six cities that saw an uptick in home prices on both an adjusted and unadjusted basis. (positive growth, not just a slowdown in contraction).
Blizter adds: “To add more mixed signals, we are in a seasonally weak period for homernprices, so the seasonally-adjusted data are generally more positive,rnwith 14 of the markets and both composites showing improved prices inrnNovember.”
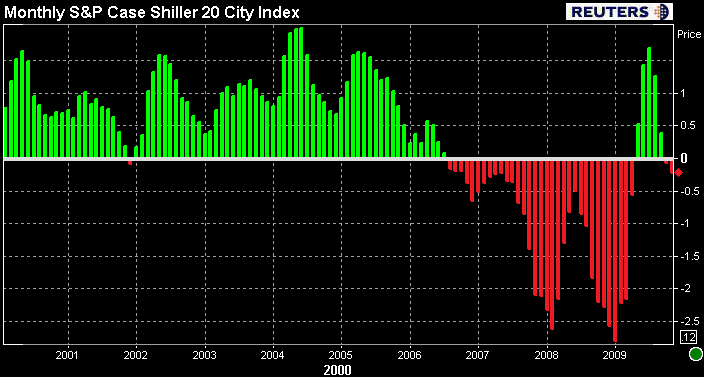
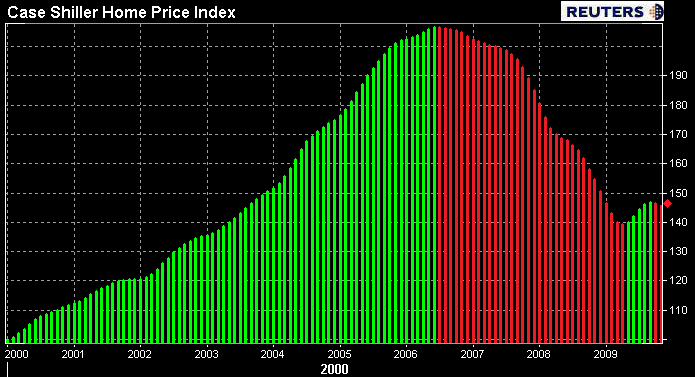
Looking at the 20 city index in absolute terms you can see the housing market is showing signs of stabilization from a threernyear losing streak (RED). Over the summer home pricesrnbegan to rebound on a month over month basis, however since the summerrnbuying season came to an end the housing market has started to lose momentum. This is really a function of a generally slow winter home buying season.
Blitzer says: “On balance, while these data do show that home prices are farrnmore stable than they were a year ago, there is no clear sign of arnsustained, broad-based recovery.”
Not trying to highlight weakness as much call attention to the perception of recovery vs. the perception of stabilization buuuuuut…
Relative to the speed and extent the housing market rose and fell, not much progress has been made towards a recovery, just a stabilization from free fall. This above chart illustrates the marginal progress that has been made. While we are encouraged to see home prices rebounding from a rapid slowdown, we are still searching for confidence that the spring buying season will be as bright as many believe. Continually high delinquency rates, failed loan modifications, and uptick in foreclosures are the main argument against an evolving positive forward looking outlook for housing prices. I will refrain from shouting JOBS JOBS JOBS in this post….
But you can read more about the outlook for housing HERE
All Content Copyright © 2003 – 2009 Brown House Media, Inc. All Rights Reserved.nReproduction in any form without permission of MortgageNewsDaily.com is prohibited.
About the Author
devteam
Steven A Feinberg (@CPAsteve) of Appletree Business Services LLC, is a PASBA member accountant located in Londonderry, New Hampshire.
See all blogsLatest Articles
By John Gittelsohn August 24, 2020, 4:00 AM PDT Some of the largest real estate investors are walking away from Read More...
Late-Stage Delinquencies are SurgingAug 21 2020, 11:59AM Like the report from Black Knight earlier today, the second quarter National Delinquency Survey from the Read More...
Published by the Federal Reserve Bank of San FranciscoIt was recently published by the Federal Reserve Bank of San Francisco, which is about as official as you can Read More...
Comments
Leave a Comment