
Blog

The Million Dollar Question: Have Home Prices Bottomed?
Woohoo! The April S&P/Case-Shiller Home Price Indices showed a monthly increase* in home prices for the first time in eight months today. </p
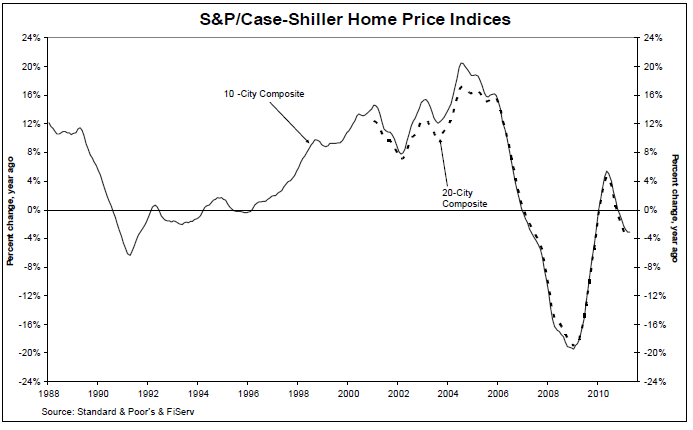
On a month-over-month basis, the 10- and 20-City Composites were up 0.8% and 0.7% in April versus March. The chart below illustrates the annualized returns of the 10-City andrn the 20-City Composite Home Price Indices. In April 2011, the 10-City and 20-City Composites recorded annual declines of -3.1% and -4.0%, respectively.</p
 </p
</p
Oh wait a minute, there is an asterisk* to address before we can get excited about positive news in housing.</p
“In a welcome shift from recent months, this month is better than last – April’s numbers beat March,” says David M. Blitzer, Chairman of the Index Committee at S&P Indices. “However, the seasonally adjusted numbers show that much of the improvement reflects the beginning of the Spring-Summer home buying season. It is much too early to tell if this is a turning point or simply due to some warmer weather.”</p
Ugh. Mr. Blitzer is a bucket of cold water (rightfully so). Why does distinguishing between seasonally adjusted and non-seasonally adjusted data matter? Because Case-Shiller recommends using non-seasonally adjusted data, citing it as the morernreliable indicator. This is the last guidance S&P shared on the topic:</p
“Economic data which are affected by the time of the year, or the seasons, are often adjusted to remove these effects to make it easier to identify underlying changes in the economy. Seasonal adjustment increases the unadjusted values in weak months and decreases the unadjusted values in strong months to eliminate regular seasonal patterns while leaving the underlying trend unaffected. For the S&P/Case-Shiller Home Price Indices, S&P reports two data sets –rn before seasonal adjustment and seasonally-adjusted. In some recent reports the two series have given conflicting signals, with the seasonally-adjusted series rising month-over-month and the unadjusted series declining. After reviewing the data, the S&P/Case-Shiller Home Price Index Committee believes that, for the present, the unadjusted series is a more reliable indicator</b and, thus, reports should focus on the year-over-year changes where seasonal shifts are not a factor. Additionally, if monthly changes are considered, the unadjusted series should be used." </p
Plain and Simple: The headline many news editors will write, “Home Prices See First Increase in Eight Months”, is based off the monthly, non-seasonally adjusted data. That seems like a glimmer of good news for housing, especially after one remembers that S&P told us to focus on the non-seasonally adjusted data, but Mr. Blitzer wants us to contain our excitement until a new trend develops that confirms a home price stabilization. We need to see progress on a monthly basis and we need it to show up in annual comparisons as well. This is because seasonal adjustments tend to decrease unadjusted values in strong months to eliminate regular seasonal patterns, such as nice weather. So what Mr. Blitzer is basically telling us is, “This is a step in the right direction but we don’t know if it’s gonna last. More positive data is needed to confirm a potential stabilization”.</p
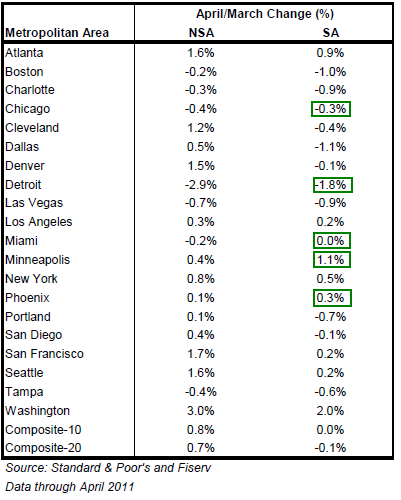
A summary of the monthly changes using the seasonally adjusted (SA) and non-seasonally adjusted (NSA) data can be found in the table below. rn Looking closer, one can see why Mr.Blitzer is skeptical of the month-over-month improvement. There is a 0.8% difference between non-seasonally adjusted data and seasonally adjusted data. In only 5 metro areas did the seasonally adjusted figure outperform the non-seasonally adjusted figure. This makes it clear that seasonal adjustments do tend to decrease the unadjusted index values in strong months.</p
 </p
</p
Of course we’re discussing the Composite Indexes when we should be breaking down the data by individual locations. </p
Excerpts taken from the release..</p<ul
</li
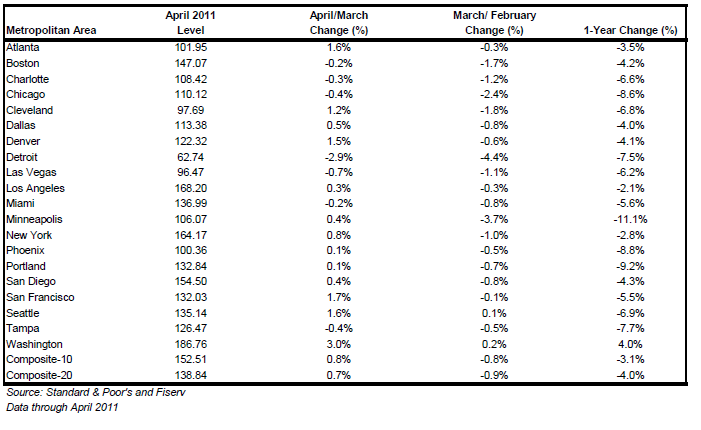
The table below summarizes the results for April 2011…</p
 </p
</p
Mr. Blitzer summed up the findings of the report nicely when he said, “For a real recovery we would need to see several months of increasing home prices, large enough to shift the annual momentum to the positive side. In short, better news, but still a lot of questions and a long way to go.”</p
That leaves us to ponder over the million dollar question: Have home prices finally hit bottom?</p
Nationally, housing faces a long road to recovery, but not all markets are equal. While areas with a high concentration of distressed properties are clearly stuck in a deflating environment, some communities will see price stability. It’s all based on local and regional economies. Where are jobs being created? Where are the best schools? Where is value being created by the community? Where do buyers want to live? This is where the housing recovery can build momentum. Of course you need to be in the right financial situation to even be asking these questions. That’s another problem all together. Tight credit demands from lenders combined with damaged borrower credit profiles (and a lack of reserves) implies buyer demand will lag the broader economic recovery, which is lagging itself. Finding a bottom in the hardest hit areas is another story. Here, the GSEs, FHA, and major banks must manage their REO inventory carefully. In these areas, home prices remain highly-sensitive to even the smallest of shocks in buyer sentiment, such as the premature release of shadow inventory. It’s gonna be a tight-rope walk. Step 1 is stopping the negative feedback loop.</prn
ABOUT: The indices, which are billed by S&P as the leading measure of U.S. home prices, are constructed to track the price path of typical single-family homes in a number of metropolitan statistical areas (MSAs). The study uses matched price pairs of individual houses to construct a 20-City Composite Index and a 10-City Composite Index which are updated monthly. The indices have a base value of 100 which was set in January 2000. Thus a current index value of 150 indicates there has been a 50% appreciation since that date for a typical home in the subject market. To be eligible to be included in the home price indices, a house must be a single-family dwelling. Condominiums and co-ops are specifically excluded. S&P Indices does publish some separate, supplemental indices for condominiums. Houses included in the indices must also have two or more recorded arms-length sale transactions. New construction is excluded.
All Content Copyright © 2003 – 2009 Brown House Media, Inc. All Rights Reserved.nReproduction in any form without permission of MortgageNewsDaily.com is prohibited.
About the Author
devteam
Steven A Feinberg (@CPAsteve) of Appletree Business Services LLC, is a PASBA member accountant located in Londonderry, New Hampshire.
See all blogsLatest Articles
By John Gittelsohn August 24, 2020, 4:00 AM PDT Some of the largest real estate investors are walking away from Read More...
Late-Stage Delinquencies are SurgingAug 21 2020, 11:59AM Like the report from Black Knight earlier today, the second quarter National Delinquency Survey from the Read More...
Published by the Federal Reserve Bank of San FranciscoIt was recently published by the Federal Reserve Bank of San Francisco, which is about as official as you can Read More...
Comments
Leave a Comment